Chart Series
 BCGControlBar Pro (MFC)
BCGSuite (MFC)
 BCGControlBar for .NET
Series formatting includes the following customizable elements, which can be applied to the whole series or to each data point individually:
- Fill color
- Line color
- Line width and stroke style
Several ways to create a series:
- Automatically. A series of the current chart type is created automatically when you add data to the chart or are trying to access a series by index.
- Explicitly, with the operator "new." In this way you can also control the order of series being added to the chart control.
Stacked, Full Stacked, and Range types can be specified at runtime and do not require recreation of series and data or applying new formatting.
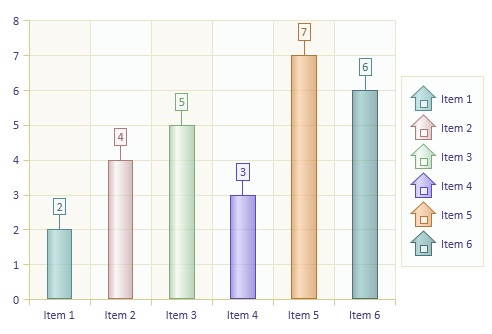
Include Data Point Labels in Legend
This option can be turned on and off dynamically at runtime and allows inclusion of individual data point values (with customized content) in the legend.
Series can be shown or hidden dynamically at runtime. Different series types can be displayed simultaneously on the same plot area.
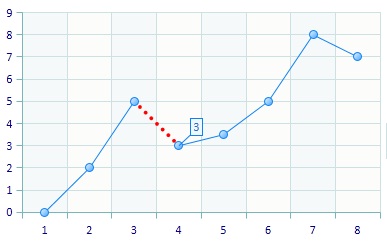
Custom Data Point Format:
Data Points in Legend
Sample code:
CBCGPChartVisualObject chart;
CBCGPChartSeries* pSeries1 =
	chart.CreateSeries(_T("Series 1"));

pSeries1->AddDataPoint(0.);
pSeries1->AddDataPoint(2.);
pSeries1->AddDataPoint(5.);
pSeries1->AddDataPoint(3.);
pSeries1->AddDataPoint(3.5);
pSeries1->AddDataPoint(5.);
pSeries1->AddDataPoint(8.);
pSeries1->AddDataPoint(7.);

const int nDataPointIndex = 3;

pSeries1->SetSeriesLineColor(
	CBCGPBrush(CBCGPColor::Red),
	nDataPointIndex);

pSeries1->SetSeriesLineWidth(
	4,
	nDataPointIndex);

pSeries1->SetSeriesLineDashStyle(
	CBCGPStrokeStyle::BCGP_DASH_STYLE_DOT,
	nDataPointIndex);